
How to measure engagement at a trade show beyond visitor numbers
the number of visitors to the stand does not tell you whether the trade show has worked. Measure three layers: attention (how many stop and for how long), interaction (how many take part in demos or games) and results (qualified leads, meetings, opportunities and sales). Compare the total cost of the trade show with the value generated.

Why counting visitors is not enough
A full stand can have a poor result if the visitors are curious people with no buying profile. And a quiet stand can close excellent opportunities if the attendees are the right ones. Quality matters more than volume.
Layer 1. Attention
- People who stop in front of the stand (manual count, sensors or cameras with aggregated, anonymous analysis).
- Entry rate: visitors who enter ÷ people who walk past.
- Average dwell time.
- Footfall peaks by time slot.
Layer 2. Interaction
- Demonstrations delivered and average duration.
- Completion rate of the experiences.
- Participants in games or challenges and scores.
- Sales conversations held.
- Downloads of catalogues or QR scans.
- Content shared on social media.
Layer 3. Results
- Total leads and qualified leads.
- Meetings booked.
- Open opportunities and their value.
- Sales attributed to the trade show (short and medium term).
- New contacts from target accounts.
- Mentions and media presence.
Perception metrics
- Quick survey of visitors about their experience.
- Net Promoter Score of the demonstration.
- Sales team's views on the quality of the conversations.
How to capture the data
| What | How |
|---|---|
| Visitors and time | Manual count, sensors, counters |
| Interaction with demos | Analytics built into the experience |
| Leads | Capture app or CRM |
| Meetings and opportunities | CRM and sales follow-up |
| Satisfaction | On-screen survey or QR |
Calculating the return
ROI = (value generated − total cost) ÷ total cost
- Total cost: space, design, set-up, staff, travel, technology, promotion.
- Value generated: attributed sales, weighted value of open opportunities (according to likelihood of closing) and savings.
Bear in mind that the B2B sales cycle can be long: assess at 3, 6 and 12 months.
Good practice
- Set objectives before the trade show (qualified leads, meetings, demonstrations).
- Compare with previous editions and other trade shows.
- Segment by visitor type and by experience.
- Listen to the team: their observations complement the data.
- Document lessons for the next edition.
Key ideas
- Counting visitors is not measuring results.
- Measure attention, interaction and results.
- Lead quality weighs more than quantity.
- Assess over the medium term because of long sales cycles.
- Document and compare with previous editions.
Frequently asked questions
How do I measure how many people walk past the stand?
With a manual count, footfall sensors or cameras with anonymous analytics, complying with privacy regulations.
What do I do if the sales cycle is long?
Measure intermediate indicators (meetings, opportunities) and review sales at 6 and 12 months.
What is the most important metric?
Qualified leads and the opportunities generated.
Are surveys useful?
Yes, quick and short ones, to identify which experiences work.
More guides on this topic
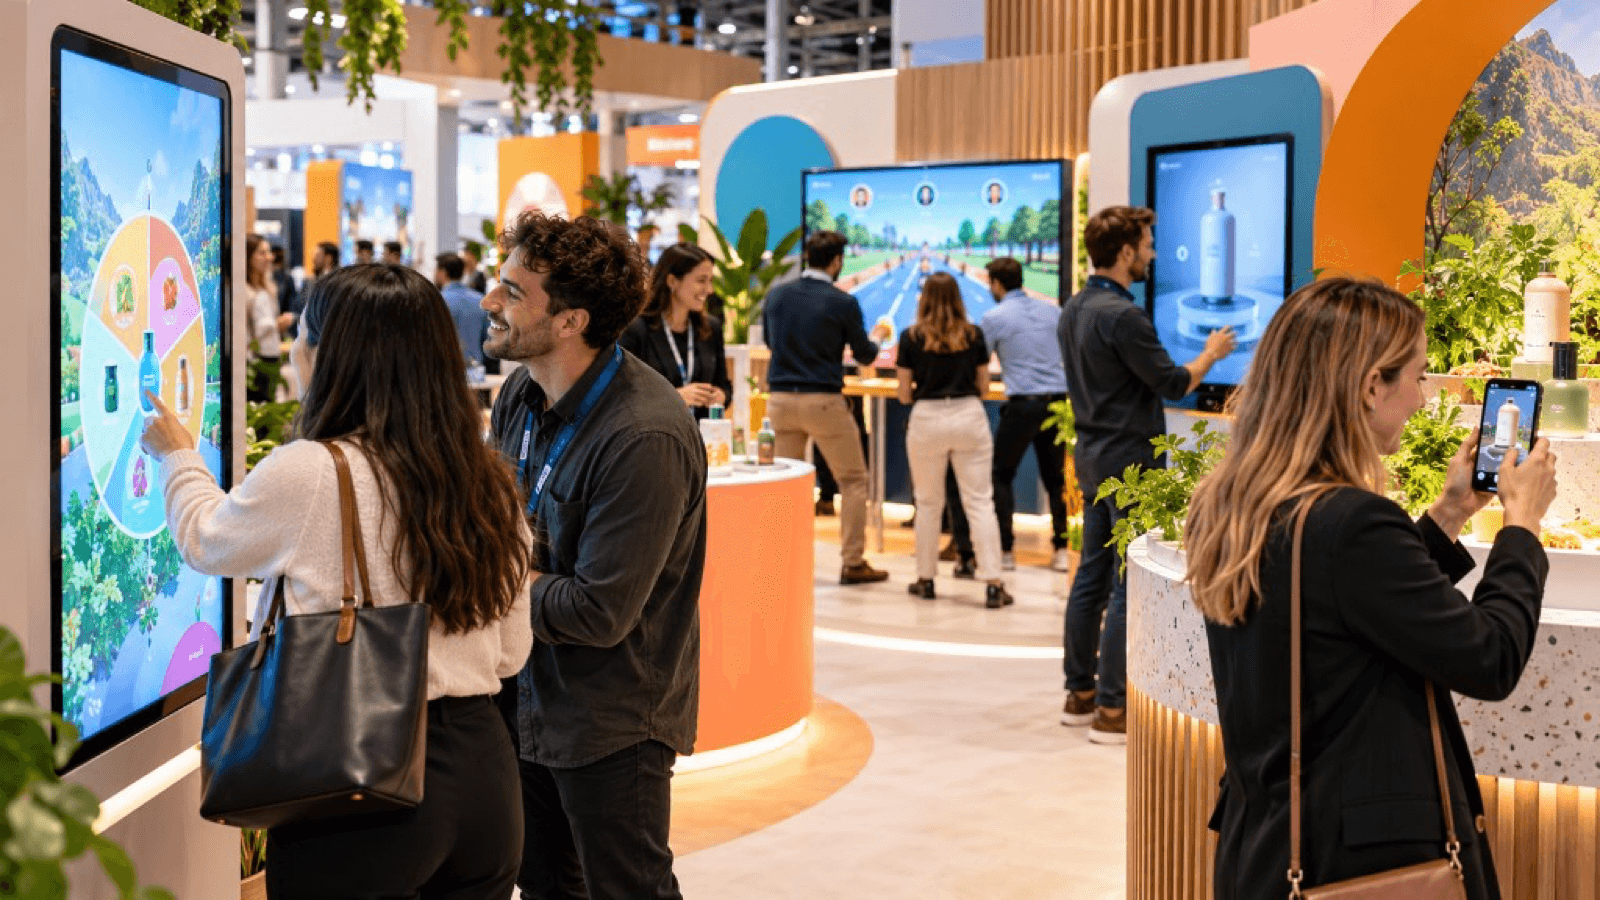
10 interactive ideas for trade shows that go beyond the gift
Ten interactive ideas to stand out at a trade show: virtual reality, games, configurators, AR, factory tours, challenges and experiences that capture qualified leads.
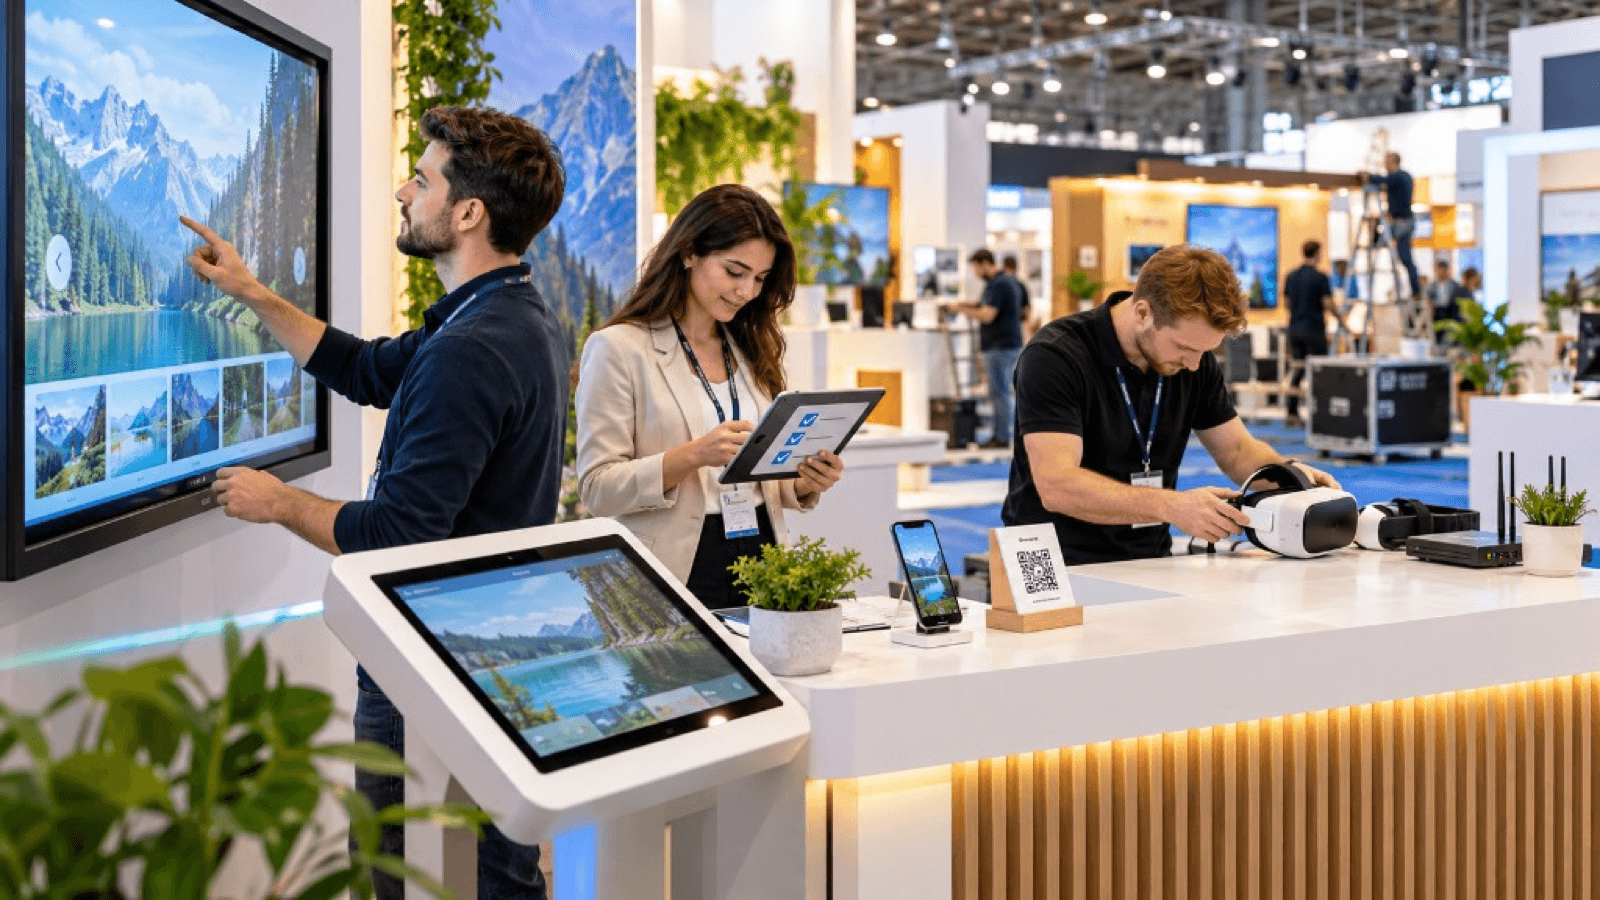
Technology checklist for trade shows: what you need before the event
Technology checklist for your trade show stand: hardware, power, connectivity, content, plan B, staff, safety, logistics and prior testing.
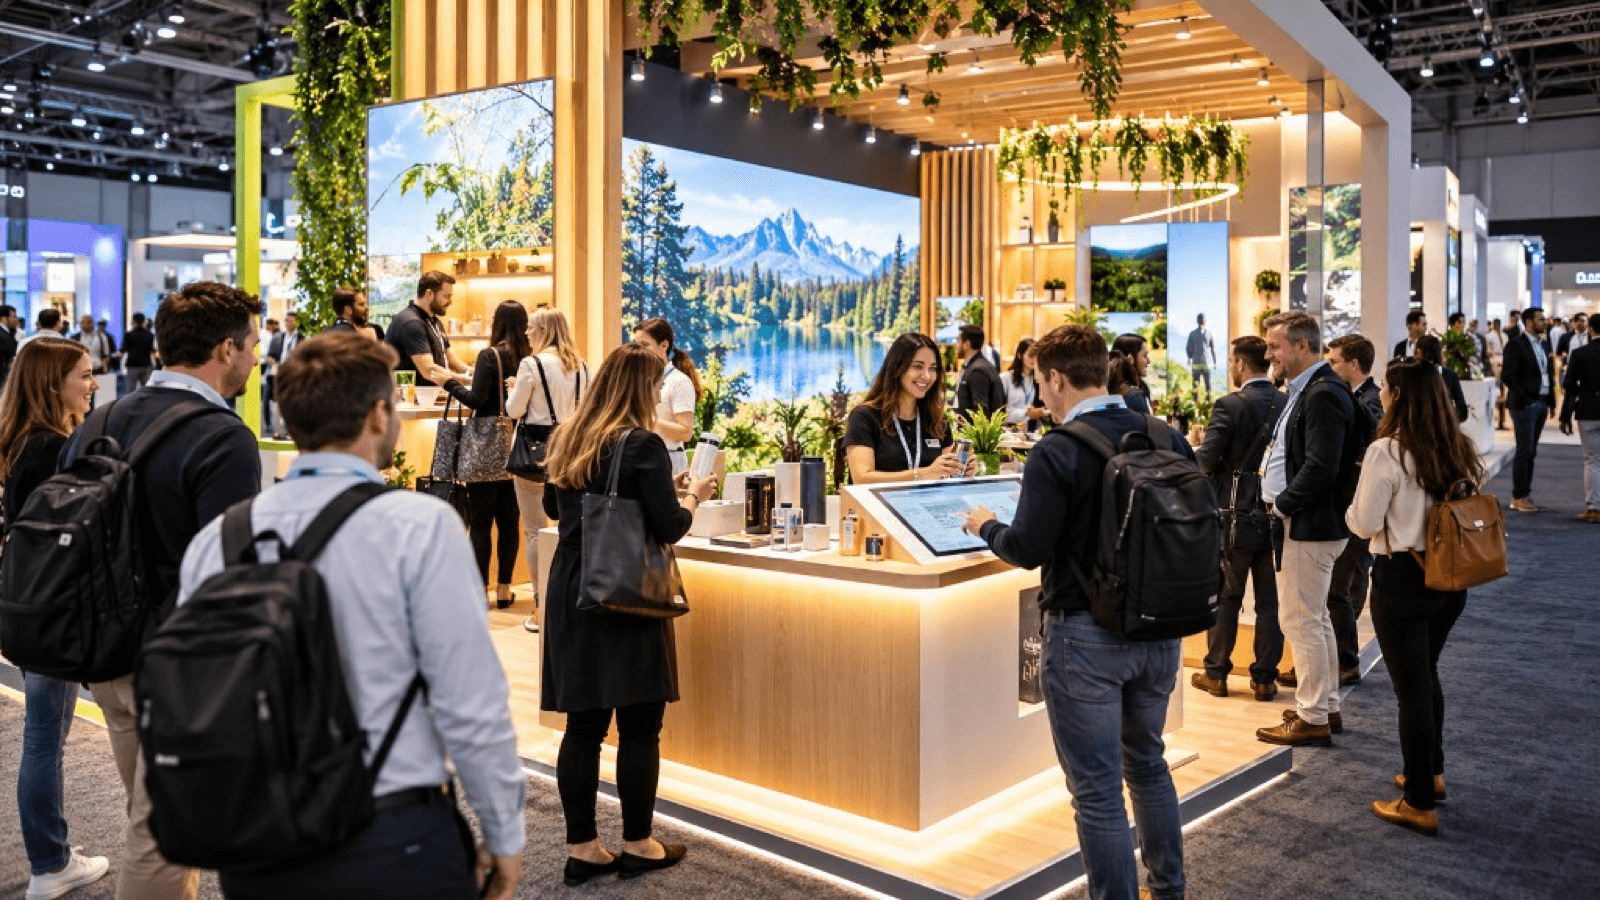
How to attract more visitors to your stand at a trade show
Strategies to attract visitors to your stand before, during and after a trade show: design, interactive experiences, digital preview, sales team and follow-up.